danieldmitriouk.com
← All projects
Case study · Web app
Portfolio Radar: a private newsroom for one stock portfolio

A private investor wants to know what is happening in his portfolio without reading news all day. The Radar reads news and official sources around the clock, cross-checks every story and explains each morning at 8 what actually matters.

10+sources, all free
08:00briefing every morning
~CHF 10running costs per month
2 daysuntil the first version ran
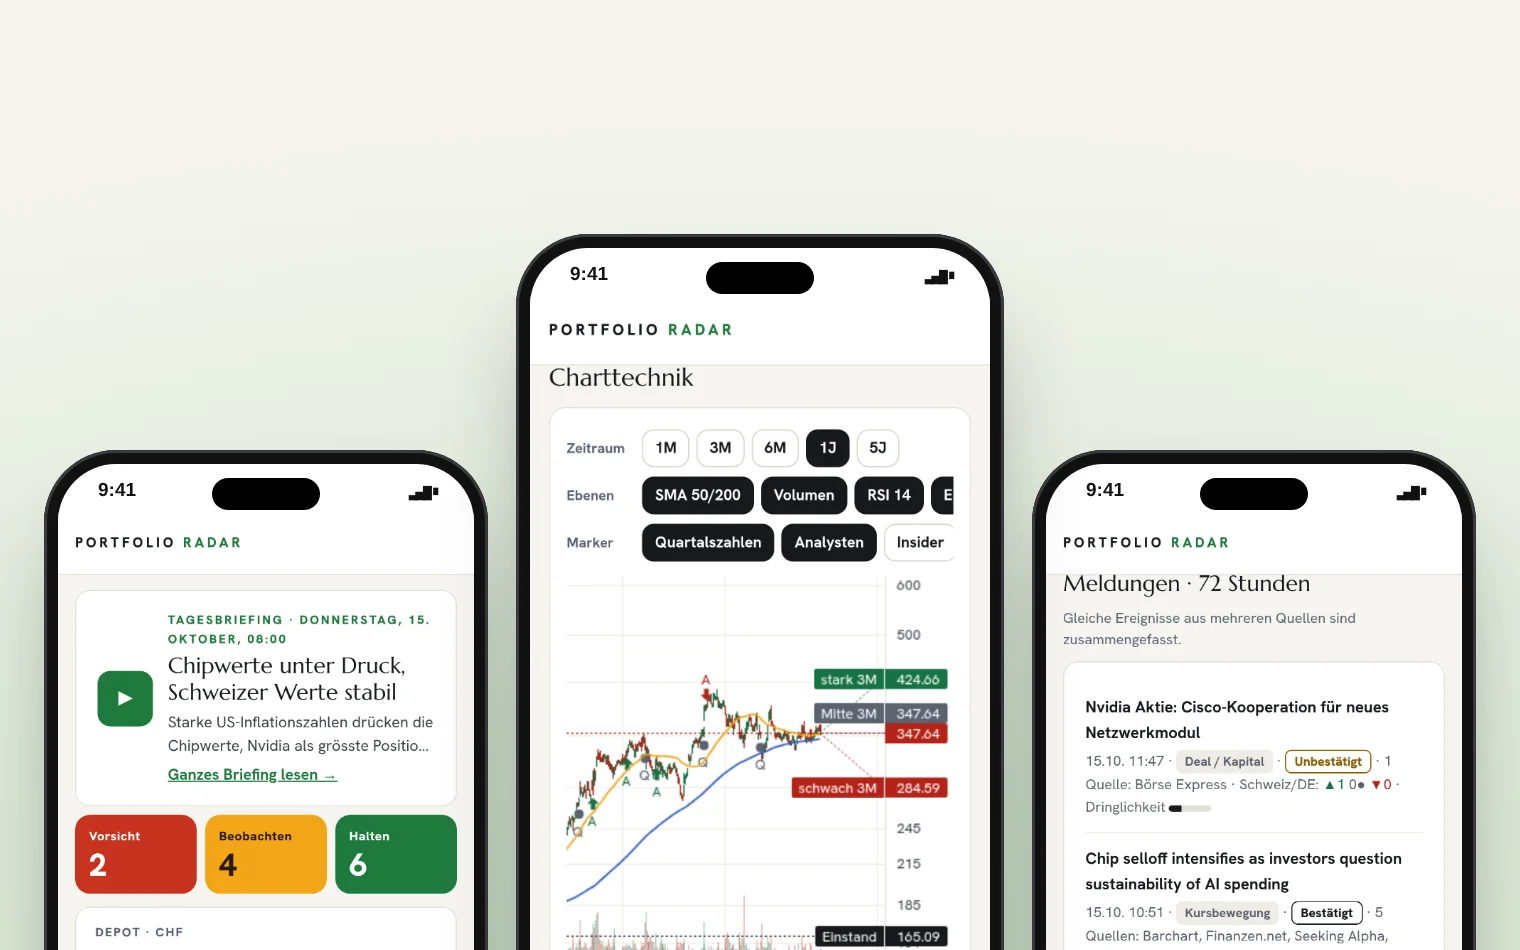
Three phones showing the Portfolio Radar briefing, chart and confirmed news

All images show a demo portfolio. The client's real positions stay private.

The starting point

Hundreds of headlines a day, five of them matter

A broad portfolio means hundreds of headlines every day, in English and German. Many of them are repeats, clickbait or old stories with a new date.

What matters are the few that really change something: a lawsuit, a regulator, a big insider buy. The question was how to find exactly those without reading news all day.

What the Radar does

Seven features, one screen per question

01

The morning briefing

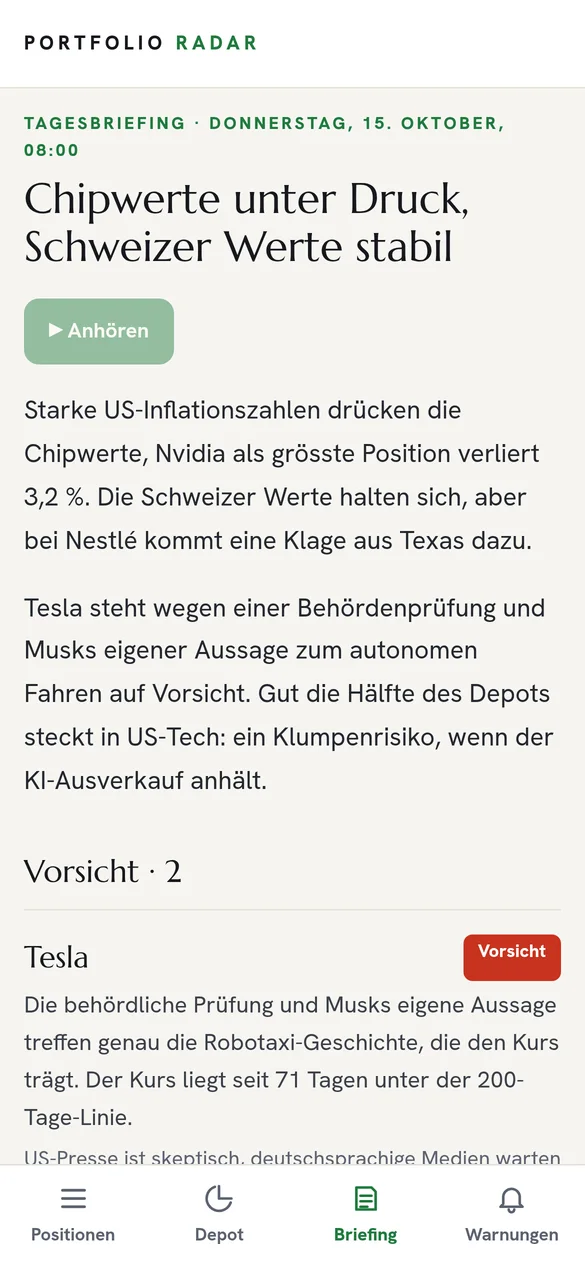
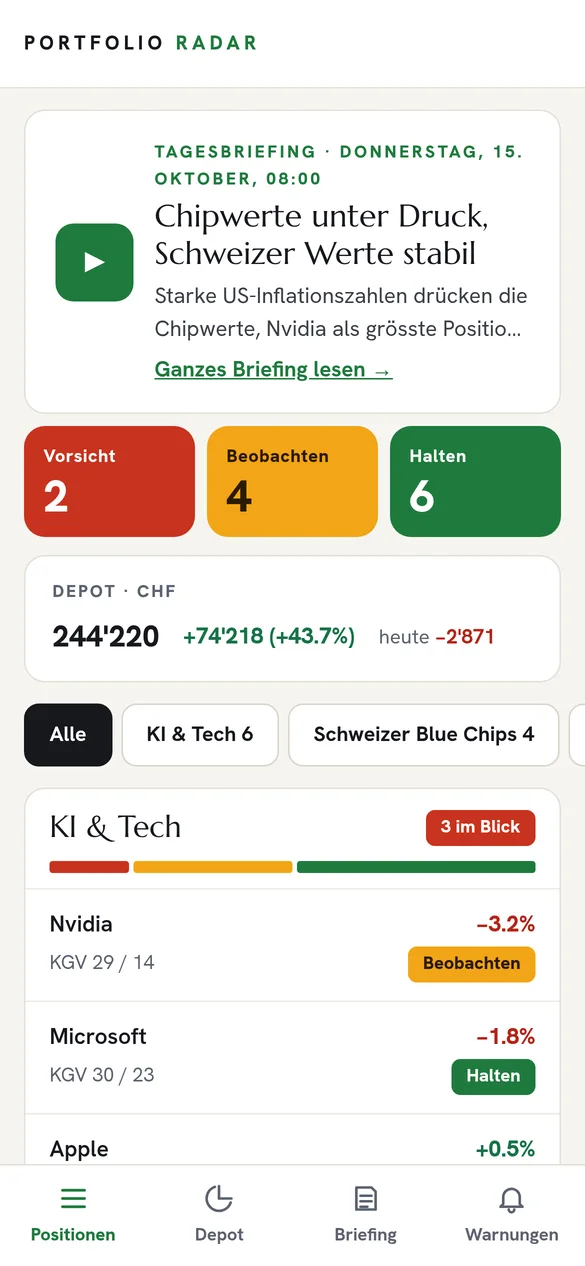
Every morning at 8, Claude writes a briefing in German: one headline, a short summary and a traffic light for every position, caution, watch or hold. Tap play and the app reads it out loud. The short version also arrives on the phone via Telegram.

  • Per position: what happened, why it matters and the biggest risk
  • A read on the P/E ratio and how international and Swiss media see it
  • Read aloud in a German voice, right in the browser
9:41
Home screen with the daily briefing and traffic lights
9:41
The full briefing
02

The whole portfolio at a glance

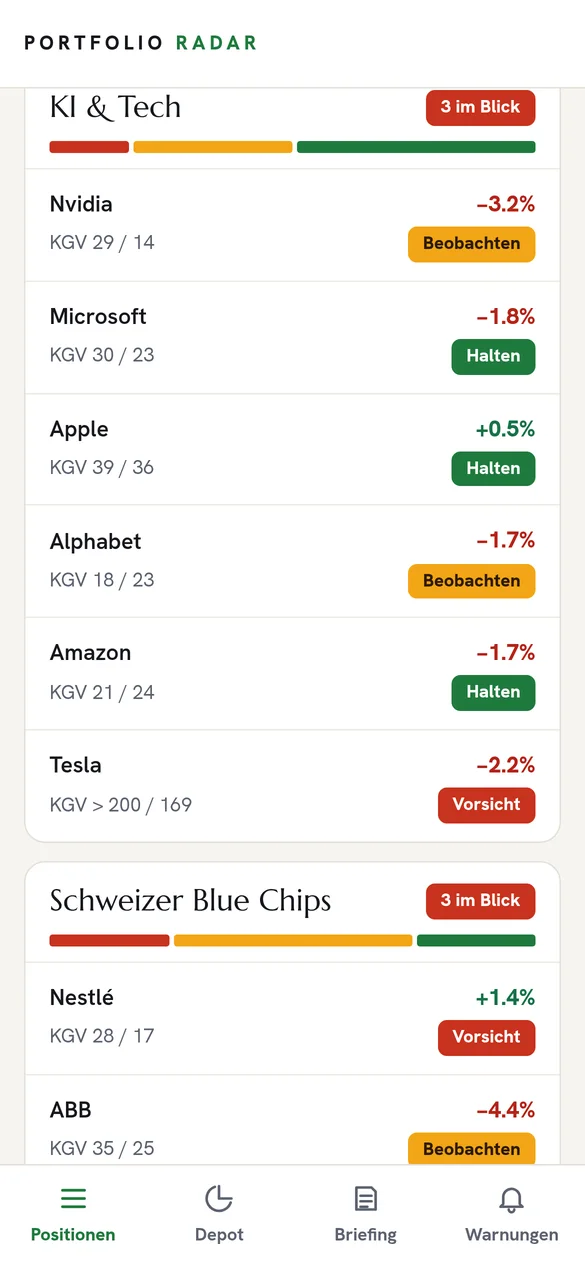
Every position grouped by theme: AI & tech, Swiss blue chips, gold & crypto. For each one, today's move, the P/E ratio and our view. A colour bar per theme shows at once where things are heating up.

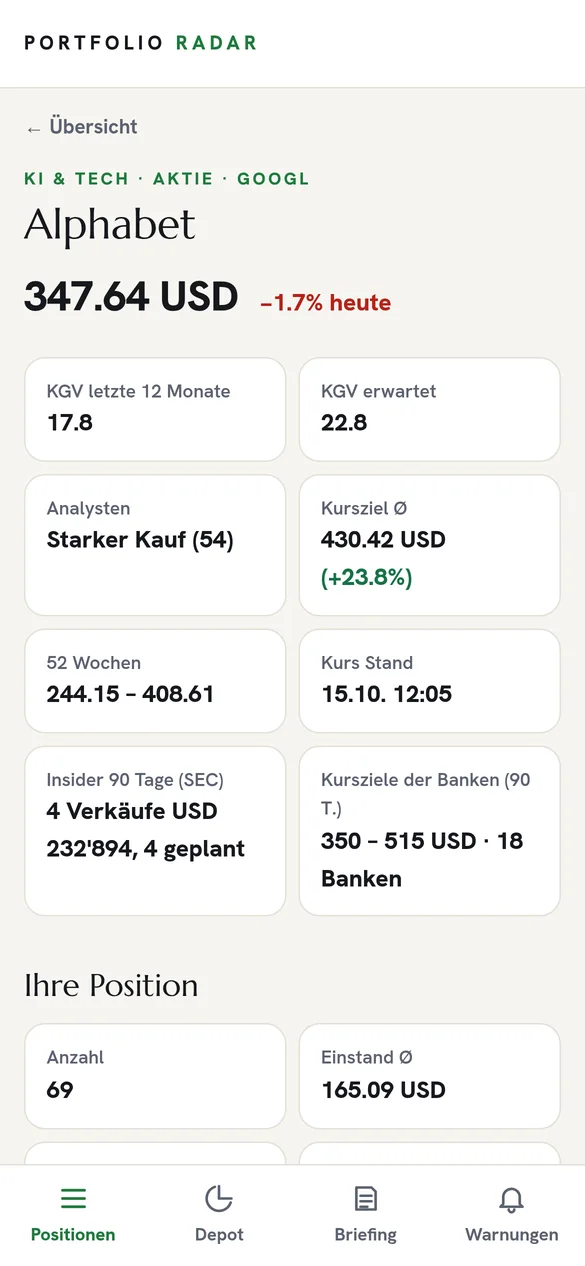
Tap a position and everything is on one screen: price, valuation, bank price targets, insider trades and your own holding.

9:41
Positions grouped by theme
9:41
The detail page of a stock
03

How a news story gets confirmed

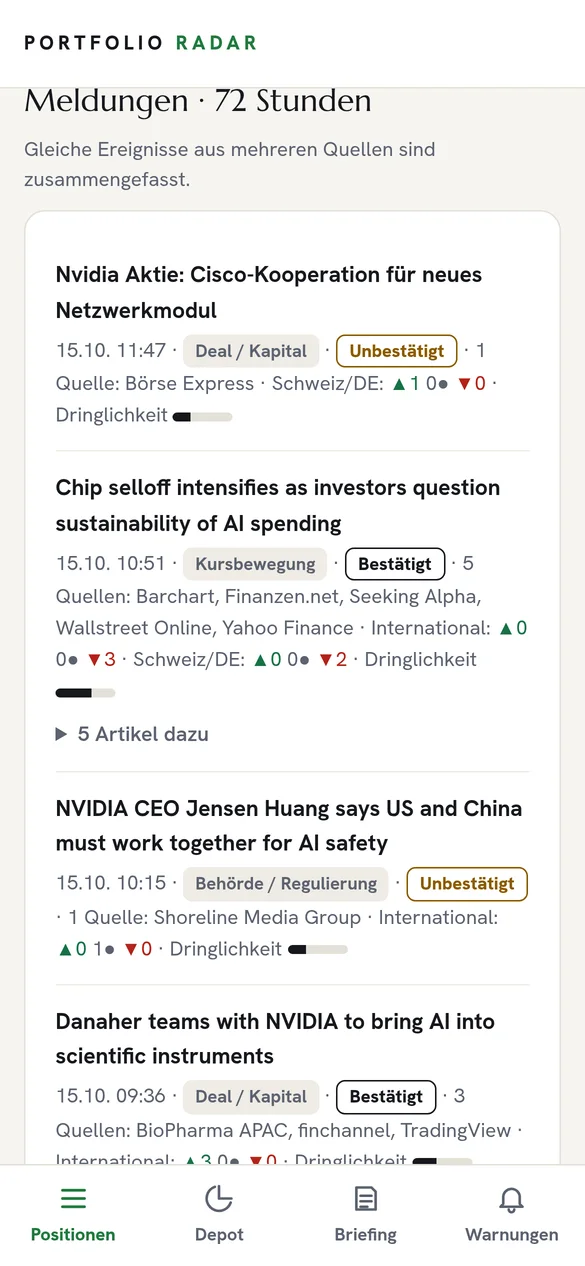
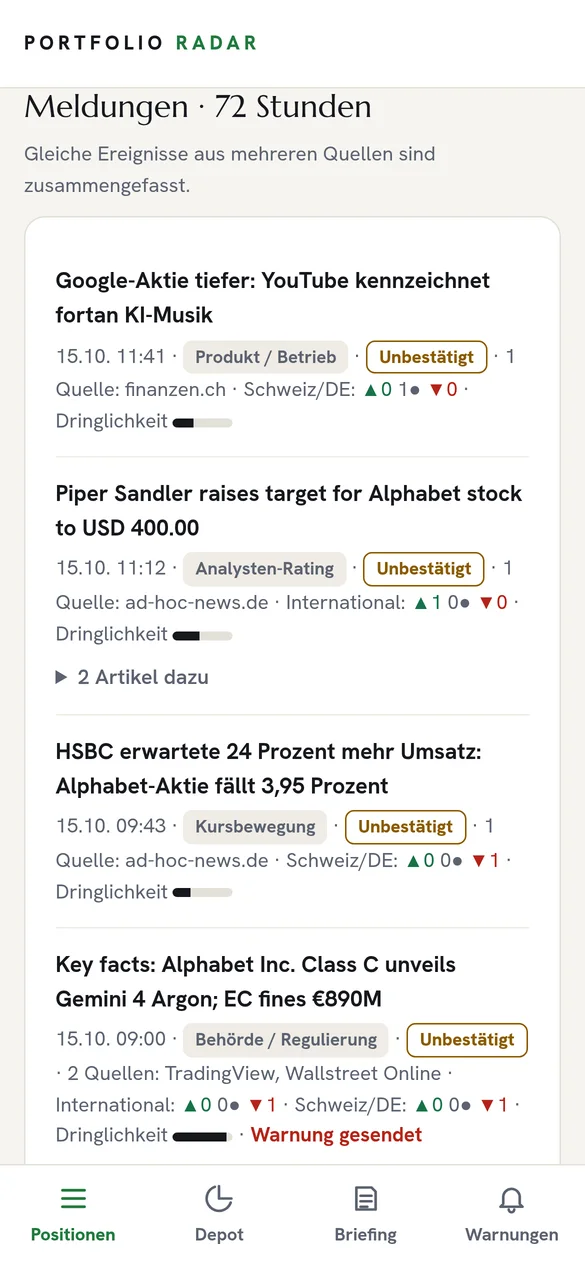
The same story often appears in ten outlets and three languages. The Radar folds it into one event and gives it a status:

  • Official: the company itself or an authority published it, for example in a filing with the SEC.
  • Confirmed: at least two independent, reputable sources report it.
  • Unconfirmed: only one source so far.
  • Questionable: the official cross-check is missing. A story about quarterly results needs the matching SEC filing within 5 days, or it never becomes an alert.

Content farms are dropped at the door, and outlets that only copy never count as confirmation. That is how the Radar caught an old story from July that a news aggregator re-dated as fresh. Instead of an alert, it was marked questionable.

9:41
News events marked confirmed and unconfirmed
9:41
Events with sources and urgency
04

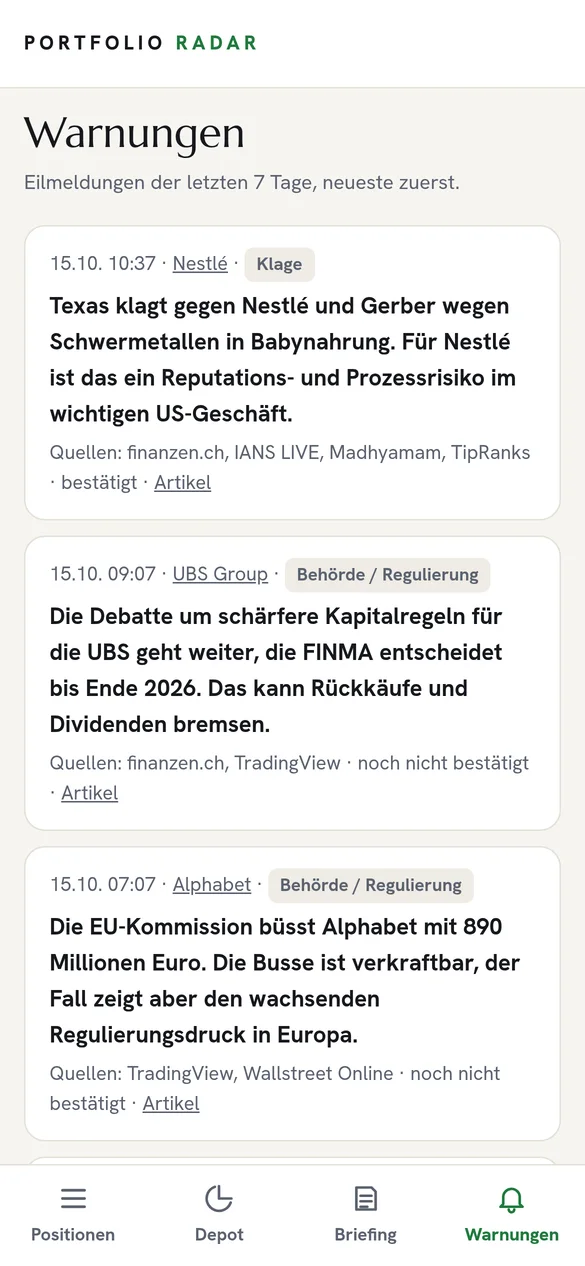
Alerts only when it really matters

A lawsuit, a regulator, a leadership exit, a big insider buy: that goes straight to the phone. Everything else waits for the briefing. The rules live in code, not in a prompt:

  • Insider buys of 100,000 dollars or more by officers or directors
  • Lawsuits only when the company is the first defendant and the case is about securities, a government body or antitrust
  • Reputable sources alert at once, anything else waits for a second, independent source
  • Price moves never trigger an alert. At most 2 per position and 12 per day

The first version of the rules would have sent 22 alerts in three days, 8 of them only about price moves. After tuning on real data it was 9, all of them real events.

9:41
The alerts page for the last 7 days
05

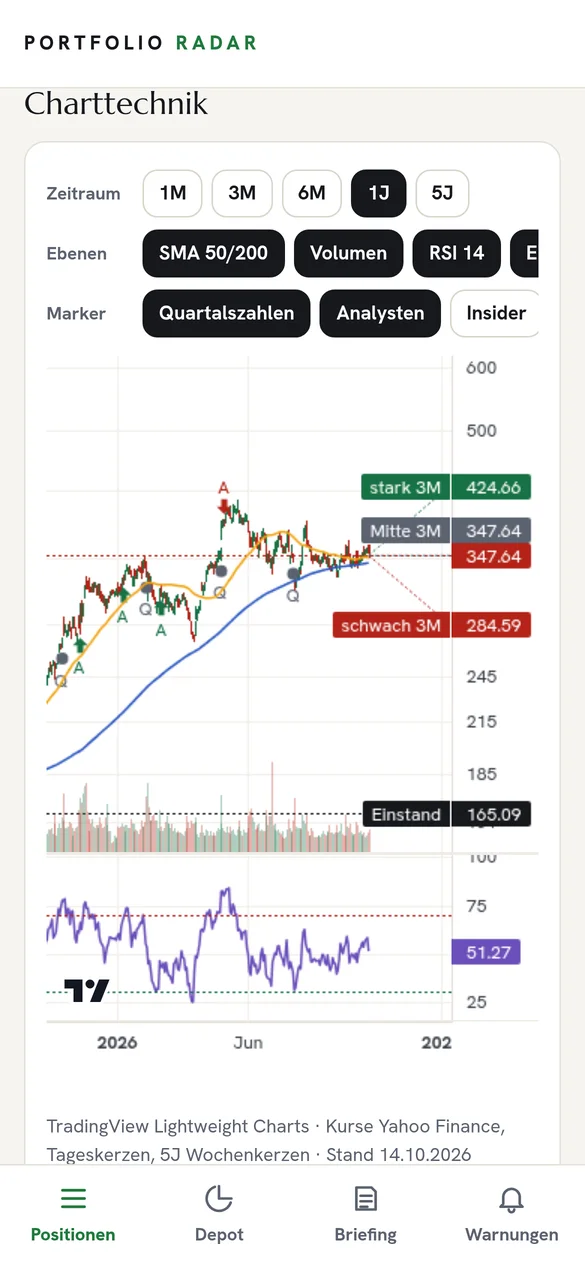
Charts for every position

A full TradingView chart with five years of daily prices. Moving averages, RSI, MACD, Bollinger bands and a dashed line at your own buy price. Quarterly results, analyst changes, insider trades, lawsuits and Radar news show up as markers right on the chart.

Below it, the P/E ratio and free cash flow yield as their own lines. Calculated from the official SEC filings and checked quarter by quarter against Yahoo Finance before going live.

9:41
TradingView chart with buy price and markers
06

What happened next

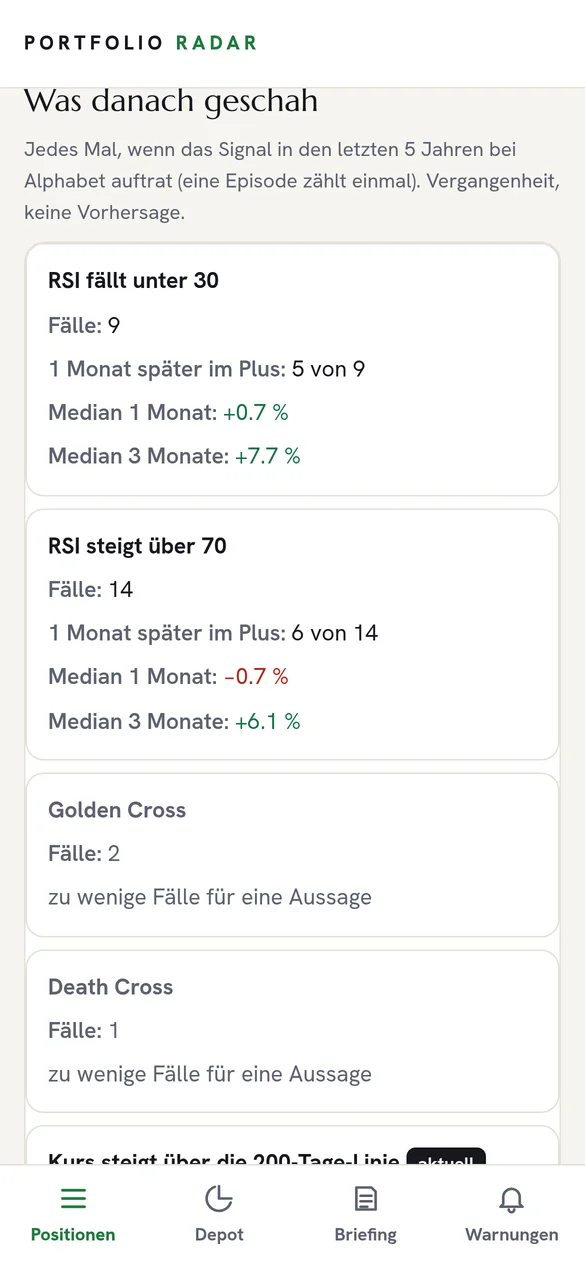
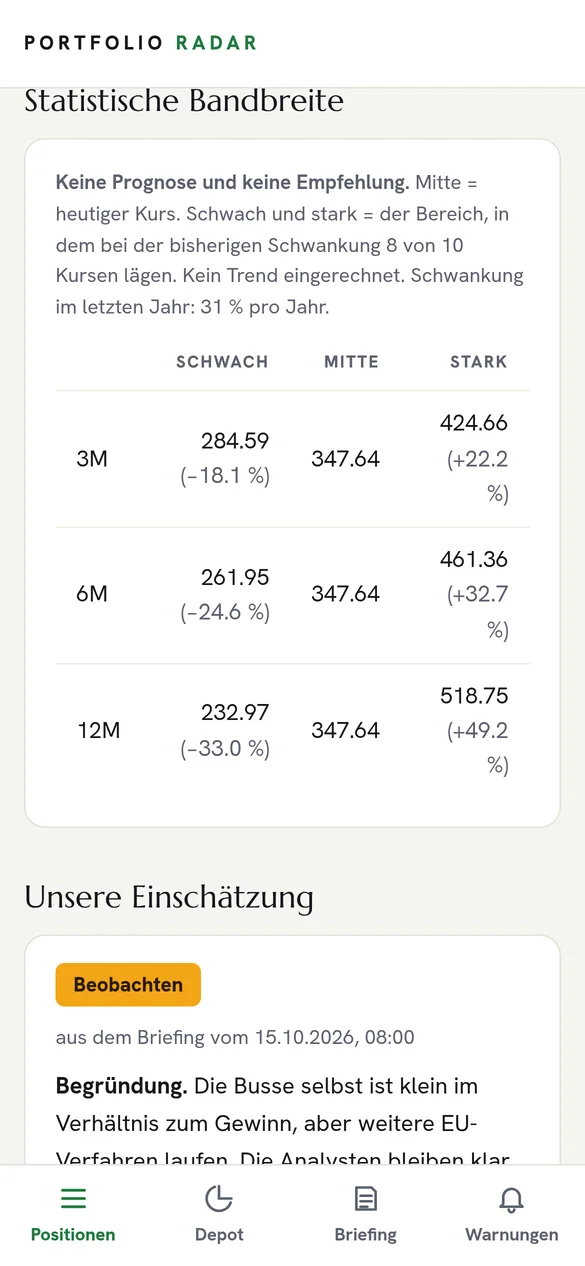
The Radar spots seven chart signals, such as RSI below 30, a golden cross or the price crossing the 200-day line. For each one it shows what this exact stock did afterwards over the last five years: how often it was up a month later, and the median after one and three months.

  • One episode counts once, with a 20-day gap
  • Fewer than 5 cases means no statement
  • The statistical range shows only how much the stock moves, never a trend

An early draft projected past returns forward and would have shown a chip stock a +560 % upside case. That is a forecast dressed up as statistics. Since then the range shows volatility only: no forecast, no recommendation.

9:41
What happened after a signal, with hit rates
9:41
Statistical range for 3, 6 and 12 months
07

Portfolio and bank import

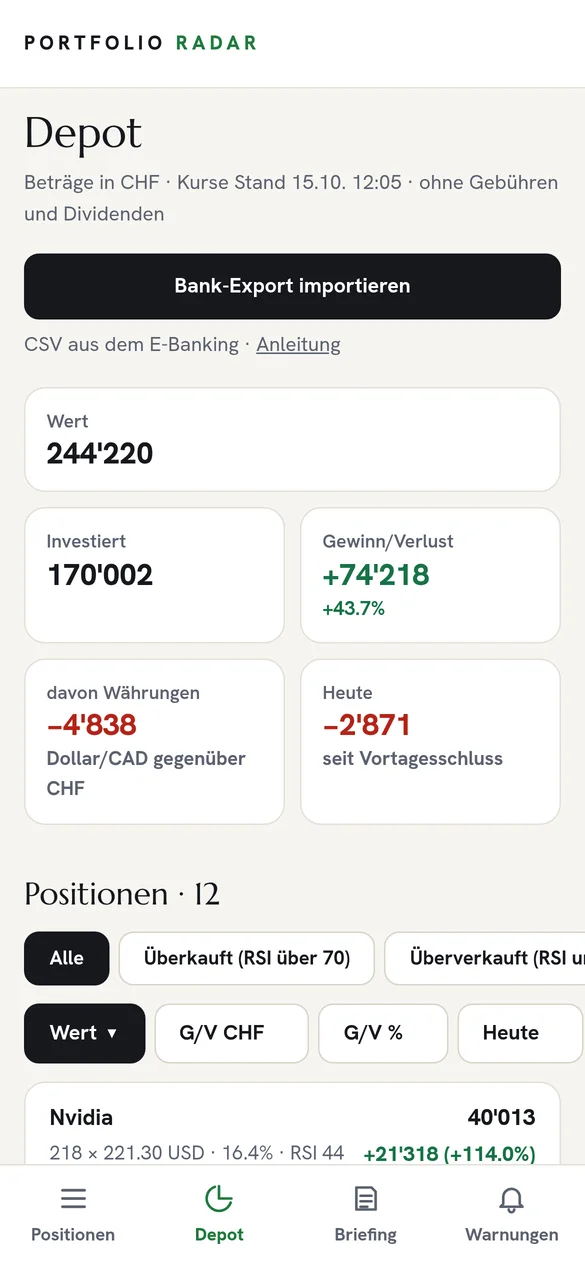
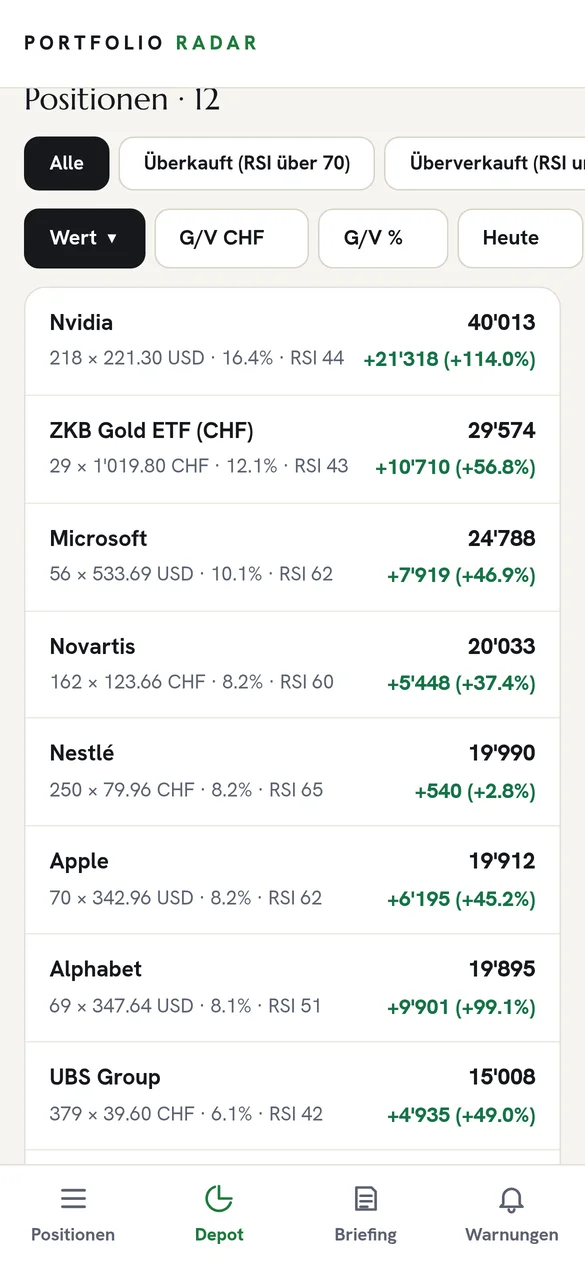
Value, profit and loss in francs, with the currency effect shown separately. Filter by chart signal or sort by gain in one tap.

Updating takes seconds: export from e-banking, import, check the preview, done. Positions are matched by ISIN. On the first check, almost every value was within 0.03 % of the bank's figures.

9:41
Portfolio value and profit in francs
9:41
Positions with an RSI filter
The method

AI for language, code for decisions

A language model should not decide what deserves an alert. So the work is split into three steps.

01

A cheap model sorts

For each headline a small AI model answers four fixed questions: type of event, really about this company, urgency from 0 to 3, stance. Cost: about 1 cent for 340 headlines.

02

Code decides

Thresholds, dates, counting, cross-checks and alert rules are Python, not AI. Tested on 330 real headlines and 10 planted test cases before a single line of app code: 10 out of 10 caught.

03

Claude writes

The large model is only used for language: the briefing and the alert text, with a fixed answer schema. Moving to a cheaper model halved the cost, after the quality was checked on the same data.

The sources

What the Radar reads, and how often

Yahoo Finance news per stockevery 15 min
Google News (EN, DE, CH), Seeking Alpha, Nasdaq, FT, CNBC, MarketWatch, NZZ, finewsevery 30 min
Prices and exchange ratesevery 5 min in market hours
P/E and analyst consensushourly
SEC: insider trades (Form 4) and company reports (8-K, 6-K)hourly
New US federal lawsuits (CourtListener)every 3 hrs
Bank rating and price target changesevery 3 hrs
Briefing in German, via Telegramdaily 08:00

Every source is free. The traffic lights are a view for the client, not investment advice.

Do you piece something together by hand every day?

Tell me in the free intro call. I will tell you honestly whether a tool of your own is worth it, how long it takes and what it costs.

Book the intro call →